Ideas
How many golf resorts have responsive websites?


BLANCHARD
This start with a pretty simple question and I was hoping to find an answer to.
And not just an answer, but how golf resorts stacked up against resorts in ski and beach as well because without some sort of context the lesson may be as meaningless as the “soft commitment” a recruit to my alma-mater just “decommitted” from (whatever that means).
I digress.
Methodology
To find my answer I decided to use the “viewport” meta tag (mainly used to tell a mobile browser to use the appropriate scale and not “zoom out” to fit 1000px of content into 320px of width) to identify responsive vs. non-responsive sites.
I did have to write in a few extra rules to account for non-responsive uses of the tag, but turned out to be really accurate in the end when I manually audited some of the results.
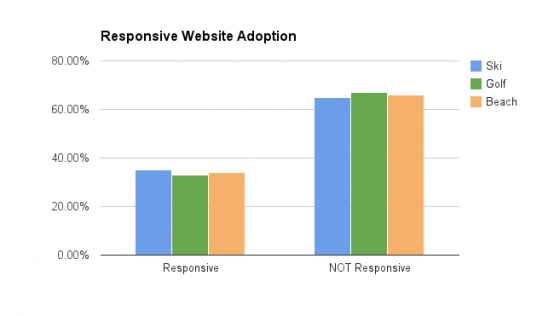
Surprisingly, the resorts I looked at all had very similar adoption rates of about 35%.
Lower Than Expected
Also surprising was the rate: 35% was a much lower rate than I expected.
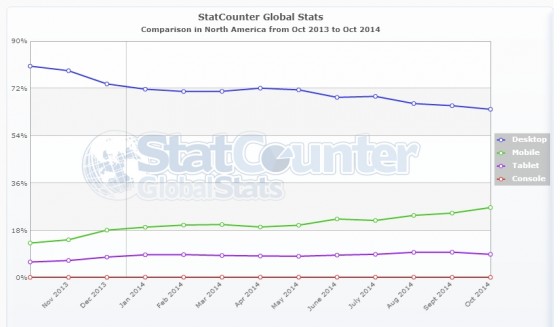
While the number is certainly on the up-and-up, but even with the few m-dot sites I came across, the vast majority simply didn’t have an option for mobile devices which is fairly important when you consider how quickly desktop traffic share is falling as mobile soars:
Look closely and you’ll see that in October of 2013, mobile made up 13.2% of traffic. This year? Double that at 26.7%.
A bigger thread than just this, I will definitely revisit this topic later and this data set again next year and see how adoption has changed.
- -
Thoughts? Feeback? I'd love to hear them. Just send me an email.
Get the weekly digest.
New stories and ideas delivered to your inbox every Friday morning.


